Good time of day!
We use nginx as load balancer and reverse proxy for some static content
(images etc).
And a problem was found with enabling SPDY: cached content with enabled
SPDY
becomes get from server with greater request time and i think slower
(according Chrome debug console).
Here some lines from access.log, without spdy, just ssl:
request_time: “0.069” upstream_response_time: “0.069” “MISS”
request_time: “0.370” upstream_response_time: “0.211” “MISS”
request_time: “1.294” upstream_response_time: “1.200” “MISS”
and from cache:
request_time: “0.778” upstream_response_time: “-” “HIT”
request_time: “0.938” upstream_response_time: “-” “HIT”
SPDY enabled:
request_time: “0.380” upstream_response_time: “0.120” “MISS”
request_time: “1.181” upstream_response_time: “0.737” “MISS”
before now everything looks fine, but now for content from cache:
request_time: “10.389” upstream_response_time: “-” “HIT”
request_time: “9.493” upstream_response_time: “-” “HIT”
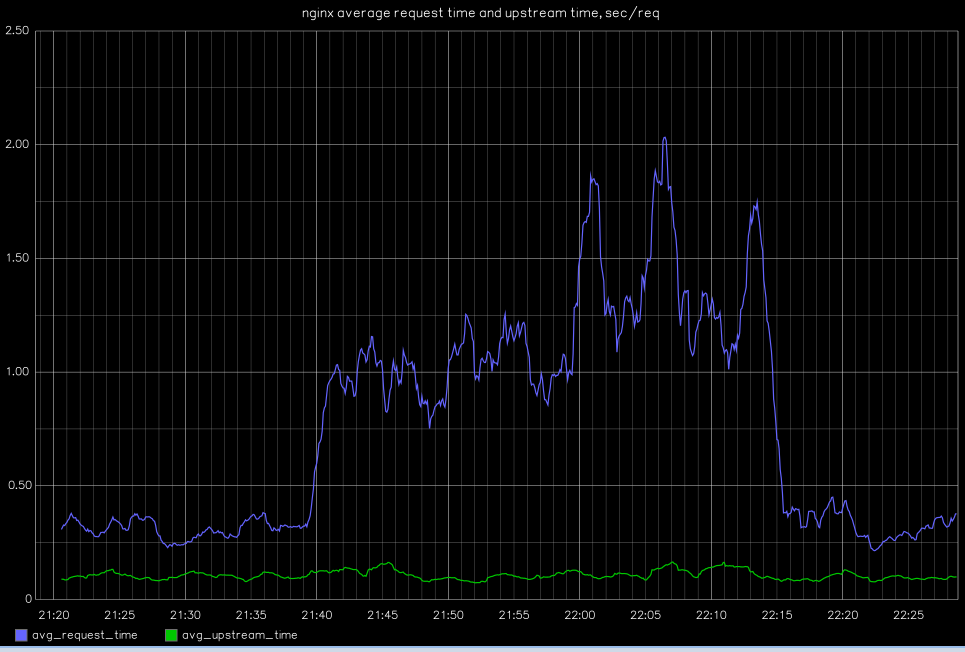
Here is a graphical illustration of problem: in the middle for some time
was
enabled spdy, but not other time on both sides.
It shows average $request_time and $upstream_response_time variables sum
every second: sum(time)/sum(requestcount) per second
Nginx cache placed on memory disk /dev/md0 , capacity 60% right now
Env: FreeBSD amd64
nginx version: nginx/1.4.2
built by gcc 4.2.2 20070831 prerelease [FreeBSD]
TLS SNI support enabled
openssl-1.0.1e
Any suggestions, thoughts, ideas?
Thanks!
Posted at Nginx Forum: