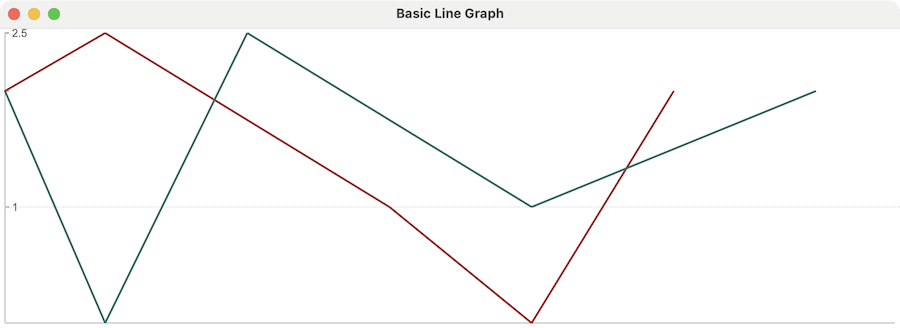
Graphs and Charts is a new library for Glimmer DSL for LibUI that aims at providing Custom Controls for rendering graphs and charts. In version 0.1.1, it supports Line Graph in a new line_graph Custom Control for rendering lines (1 or more) connecting points with different y-axis values along a time-based x-axis.
RubyGem : glimmer-libui-cc-graphs_and_charts | RubyGems.org | your community gem host
Blog Post Announcement : Code Master Blog: Graphs and Charts 0.1.1 (Custom Controls for Glimmer DSL for LibUI)